Most distribution network studies end the same way. A consultant presents a map with some dots on it, a cost saving to one decimal place, and a deck that says the model considered several hundred options. The client asks why the southern DC moved to the Midlands, and the honest answer is that the optimiser preferred it. Everyone nods. The decision gets made on trust rather than on evidence, and six months later nobody can reconstruct how the number was reached.
We built ASCALiNet because that is not good enough for the decisions it supports. A network study commits a business to leases, buildings and service levels for a decade or more. It deserves a model whose answer can be taken apart, line by line, in front of the people who have to live with it.
Scenarios in minutes: Quick answers to Deep Questions
The first thing ASCALiNet changes is how many questions you can afford to ask.
A conventional study has a practical limit on scenarios. Each one is a rebuild, a re-run, and a round of checking, so the project plan allows for three or four options and the rest of the questions get answered with judgement. That is unfortunate, because the interesting questions usually surface halfway through, once the client has seen the first set of numbers.
ASCALiNet runs a full network design in just a few minutes. A three-year scenario with a primary DC, a secondary and a satellite takes about 2-3 minutes to analyse. A fifteen-year run where the model decides the number of sites for itself takes 4-5 minutes. That is fast enough to answer a question while you are still in the room.
The practical effect is a change in how a study is run. Instead of agreeing three options up front and defending them later, you build a base scenario that reflects the network as it stands, then duplicate it for every question worth asking. What if the lease on the midlands site is not renewed? What if volume grows at four per cent rather than two? What if fuel runs ahead of inflation? Each is a copy with one thing changed, which is what makes the comparison mean anything.
Duplicating a scenario that has already been run offers to fix the sites it produced, so the copy starts from the network you have just agreed rather than from a blank sheet. That turns a sequence of scenarios into a conversation: here is the network, now here is what happens to it when the world changes.
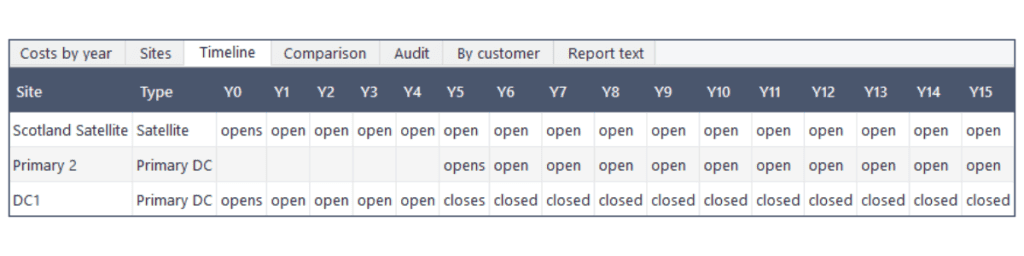
Scenarios presented year by year, showing when DCs get added and removed in the network.
ASCALiNet® is designed to fit your business
Network models tend to assume a particular kind of business: pallets, a national rate card, one product stream, a single warehouse tier. Real clients are rarely that tidy.
ASCALiNet starts from what the client actually has. If they do not move pallets, you tell it what they do move, and every screen, table and report says cages, stillages, boxes or litres from that point on. If their carrier prices in bands of load units rather than pallet by pallet, the rate card can be banded: one to two, three to five, six to ten, and so on up to a full vehicle. If their distances are better represented by their own matrix, that is what it uses.
The same flexibility runs through the network itself. Primary DCs, secondary DCs and satellites each have their own rules for how stock reaches them and how much arrives direct from the supply points. Inbound supply is modelled per channel from named factories or ports, with each one’s share of the volume. Sites can be fixed where the client already has them, with their real capacities, costs, lease end dates and exit costs, while the model is left free to choose the rest.
Scale is handled the same way. A study for a regional wholesaler with 4,000 order lines and one DC behaves the same as one for a national business with 58,000 lines, two channels and half a dozen sites. The engine works on delivery points and deliveries rather than raw lines, so a file with a million lines collapses to a problem the model can hold comfortably.
That matters commercially. The work that used to be viable only for large clients, because of the set-up effort, now makes sense for a mid-sized one as well.
Every number is traceable
This is the part we are proudest of, and it is the part that changes client meetings.
A total cost in ASCALiNet is not a destination. Double-click a year and you get every delivery the model costed in that year: the date, the delivery point, the channel, the site that served it, the road miles, the rate band it fell in, the pallets on the vehicle, the delivery cost, the cost per pallet, the handling at that site, the handling it paid further up the chain, and its share of trunking and of inbound supply. The lines add up to the year’s total exactly, to the penny.
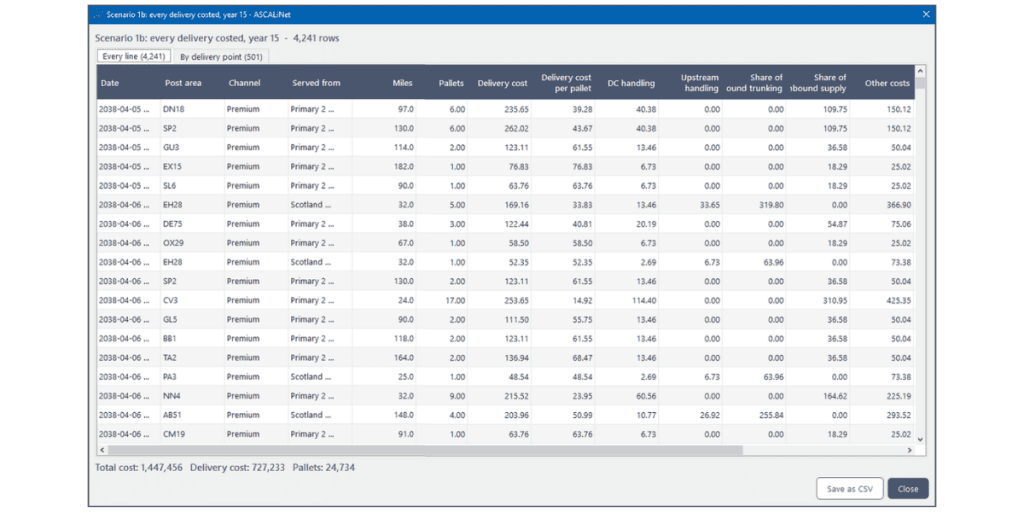
Every delivery, with each element of its cost. The same view totals by delivery point, and saves to a dowloadable file for further analysis.
The same applies to a customer. Type an account name or code and you get what it costs to serve, year by year across the horizon, with a cost per pallet that reflects everything behind the delivery: the handling at the DC, the handling at the primary the stock passed through, the trunk leg, and the inbound movement from the factory. When a client asks whether a particular account is worth the service it gets, that is the answer, not an estimate of it.
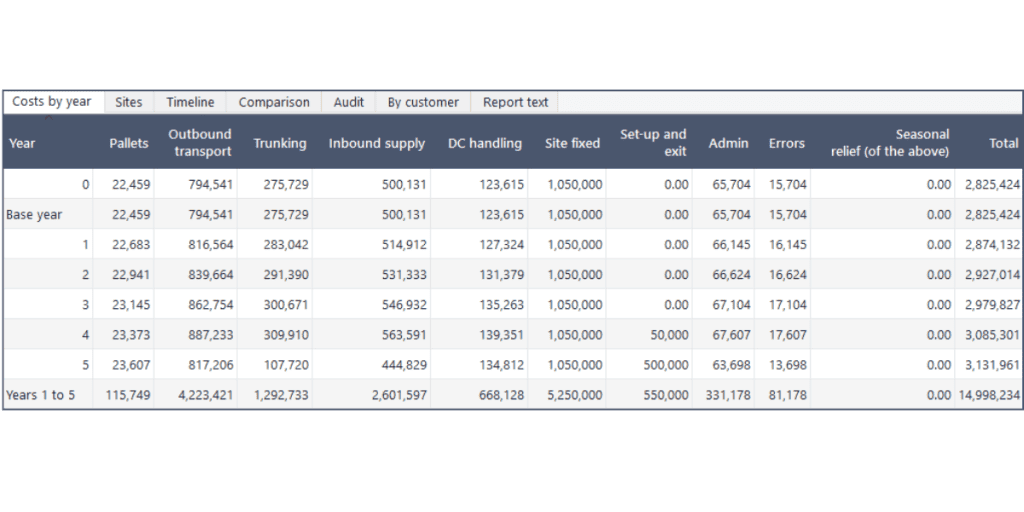
Behind that sits an audit view that lists every setting of every scenario side by side: the horizon, the inflation and discount rates, the capacities, the tolerances, the channel rules, the seasonal assumptions and the headline results. If one option is cheaper than another, the reason is visible in the settings rather than remembered from a conversation three weeks earlier.
Every setting of every scenario, grouped and compared. The quickest answer to why one is cheaper than another.
There is a further point of principle here. When ASCALiNet cannot build a network, it does not shrug. It tells you which site, which week by date, how far over it ran, and whether the binding constraint was throughput capacity, stock room, a minimum it could not meet, or a channel with nowhere to go. It then shows the years that did work, so the failure is informative rather than a dead end.
Composite and multi-channel networks, modelled properly
Most clients with more than one product stream face the same question, and most models cannot answer it. Should the streams share buildings and vehicles, or stay apart?
Running two separate studies and adding the answers together does not get you there. It cannot show a site that holds both streams while others hold one. It cannot test whether the combined volume justifies a bigger building, because the volumes never meet. And it cannot price a vehicle carrying both streams to the same customer on the same day, which is usually where the saving is.
ASCALiNet models the streams together. Each tier, and each individual site, carries the channels it is allowed to hold. A site with one channel is dedicated; a site with two or more is composite. Allocation then respects those rules, while throughput, stock holding and the weekly peak are tested on the combined volume at each site, which is what actually decides whether a building copes.
Two further switches make the question practical. Channels going to the same customer on the same day from the same site can be set to share a vehicle, which on a test file cut the delivery cost by nearly a third. And because temperature usually drives the difference, each channel can carry its own handling cost multiplier and its own stock space multiplier, so frozen genuinely costs more to handle and fills a building faster than ambient.
The result is that the composite question can be asked properly: dedicated networks, a shared secondary with separate deliveries, a shared secondary with combined deliveries, or fully composite. Four scenarios, four runs, one comparison table.
Clarity that heuristic optimisers cannot offer
Conventional network optimisers are powerful, and they are opaque. They search a very large space and return the best answer they found, which is genuinely useful, but the reasoning is inside the search. When a client asks why the model did something, the honest answer is often that it is an emergent property of the algorithm.
ASCALiNet takes a different line. It makes its decisions in an order you can follow, and it writes them down.
Sites are chosen once for the whole horizon, on total discounted cost. When the model sizes the network itself, it adds one site at a time and keeps whichever lowers total cost most, stopping when the next site cannot pay for its own fixed and set-up costs. That search is logged: you can see what three primaries cost against four, and what a secondary would have cost instead. In our experience the bottom of that curve is flatter than people expect, and the difference between the best answer and the second is often a couple of per cent. Knowing that is more useful to a client decision than the winner on its own.
Timing is just as explicit. A site opens in the first year it pays for itself, brought forward if capacity demands it, and its set-up cost falls in the year before it opens because that is when the work happens. A leased site closes at its lease end, or, where you mark the closure optional, the model costs both branches over the remaining years and keeps the cheaper: pay to leave and open a replacement, or pay the extension rent and stay. The answer comes with the arithmetic attached.
The same honesty applies to capacity. Throughput limits are tested in every week of every year, not against an annual average, because a DC that copes with 29,000 pallets a week on average may be 40 per cent over in November. Stock holding is tested the same way: weekly throughput times the weeks of stock the client carries, against the room the building actually has. And because real operations flex, you can allow a site to run over its limit by a stated percentage for a stated number of weeks a year, which is what overtime and trailer storage buy you in practice.
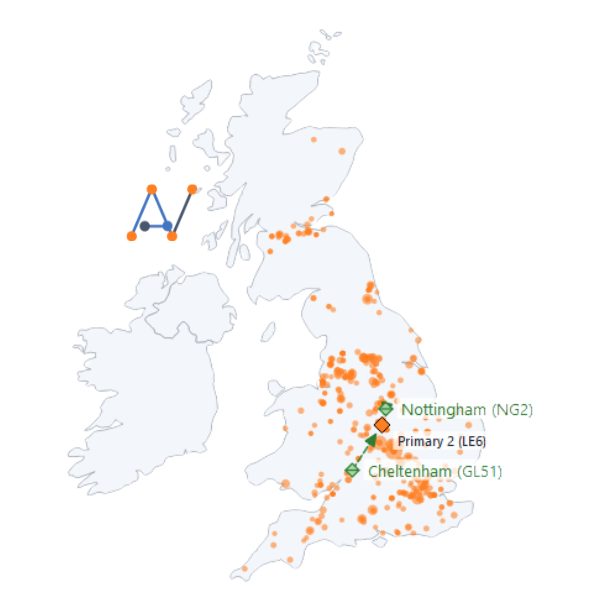
The network for any year of the horizon, with the sites, the trunk legs and the inbound supply all visible.
What this means for a study
For a client, the difference shows up in three places. The options on the table are the ones they actually care about, because asking another question costs minutes. The recommendation arrives with its workings, so the finance director can test the numbers rather than take them on faith. And the awkward questions, about peaks, leases, seasonal overflow and whether the chilled and ambient streams should share a roof, get modelled rather than estimated.
For us, it means a network study is a conversation rather than a delivery. We can sit with a client, change an assumption, and have the answer before the coffee goes cold, with every line of the cost available if they want to see it.
That is what we think the market has been missing. Not just a better optimiser, but a model that can be interrogated by the people whose money is at stake.
ASCALiNet is built and in use on live studies. If you would like to see it run against your own data, get in touch. Or to read more about our Logistics Consultancy Services, please see here.